
We all like to keep up to date on the latest property news but we don’t want to spend hours reading about it.
So this post will provide you the 6 things you need to know about the Australian property market in 60 seconds.
You’ll note we are a big fan of data so expect to see real data from trusted sources.
1. Australian housing prices are rising at the fastest rate annual rate since June 1989.
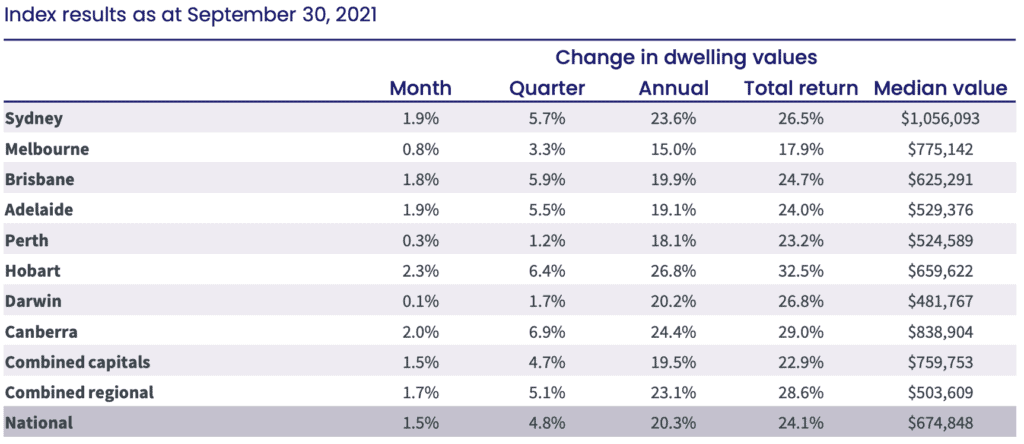
CoreLogic’s national home value index rose 17.6% over the first nine months of the year and 20.3% higher over the past 12 months (see data chart below).
This growth rate appears to be slowing with September home values increasing by 1.5% versus 2.8% in March.
House values are still generally rising faster than unit values.
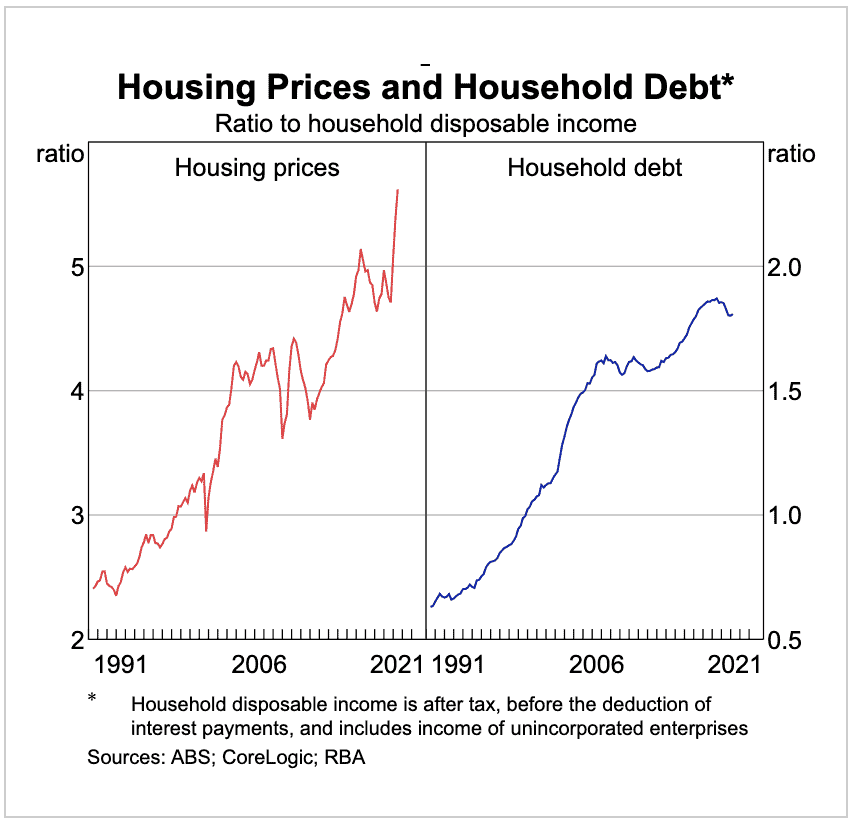
2. House prices at record high versus income
Reserve bank of Australia data shows that the house-price-to-income ratio has risen from 2.5 in the early 1990s to over 6 now.
3. Are Australians deserting the city?
Our article on 6 Key Factors That Impact Property Prices shows that the high concentration of population in our capital cities impacts home supply and therefore prices.
We also said to watch any consumer trends showing a move to regional areas.
Well, two recent data points show this “sea change” trend could be gathering momentum as the pandemic, and a shift toward more working from home, may be encouraging Australian’s to move to regional areas.
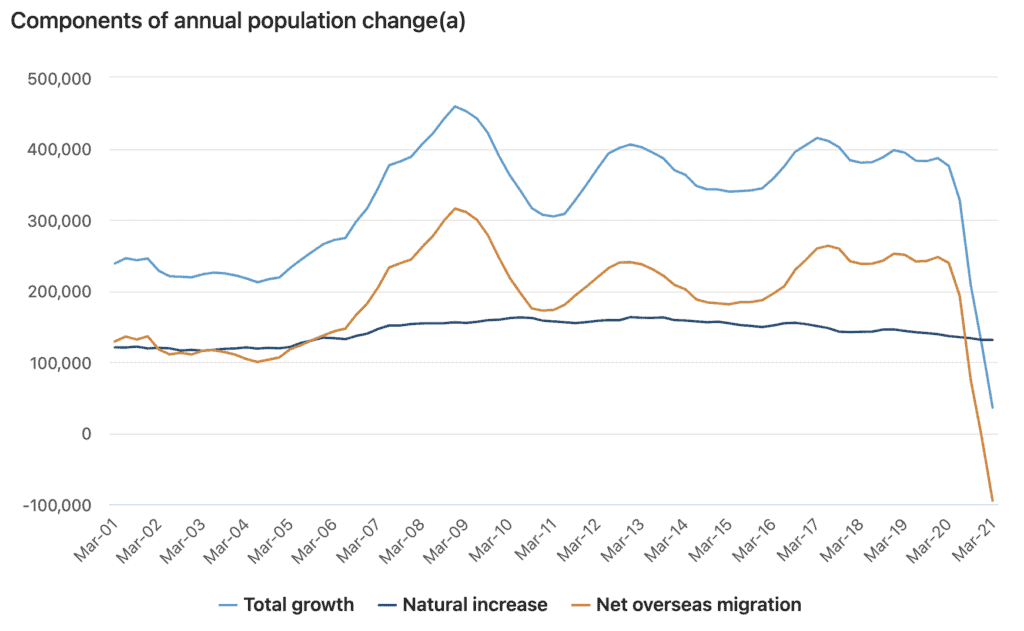
Firstly, the Australian bureau of statistics shows (see data chart below from the ABS) that in the March 2021 quarter there was a net loss of 11,800 people from Australia’s greater capital cities to regional locations through internal migration. This was the largest net loss on record since the series started in 2001.
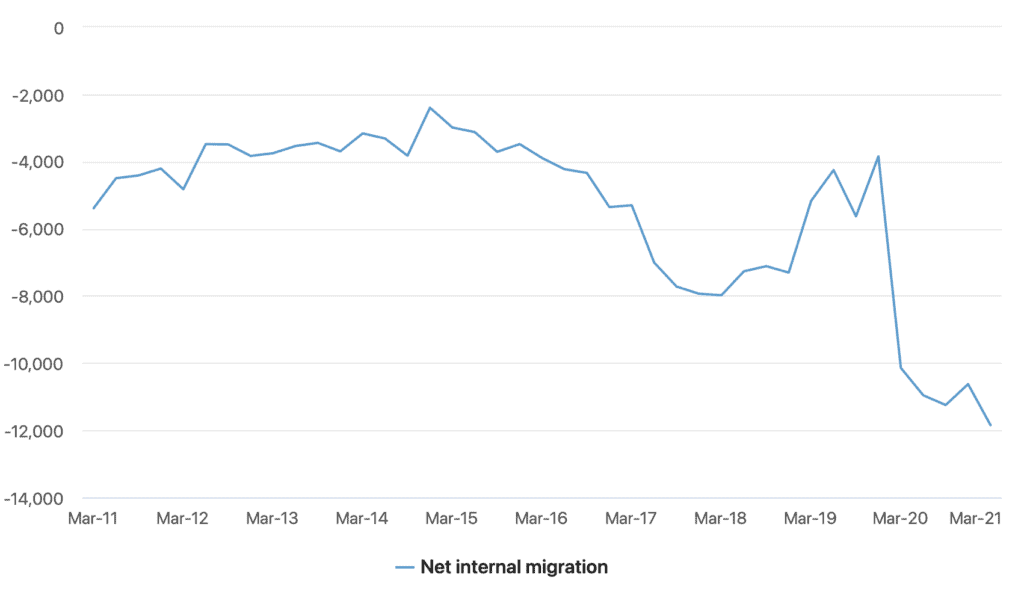
source: ABS Regional Population Statistics
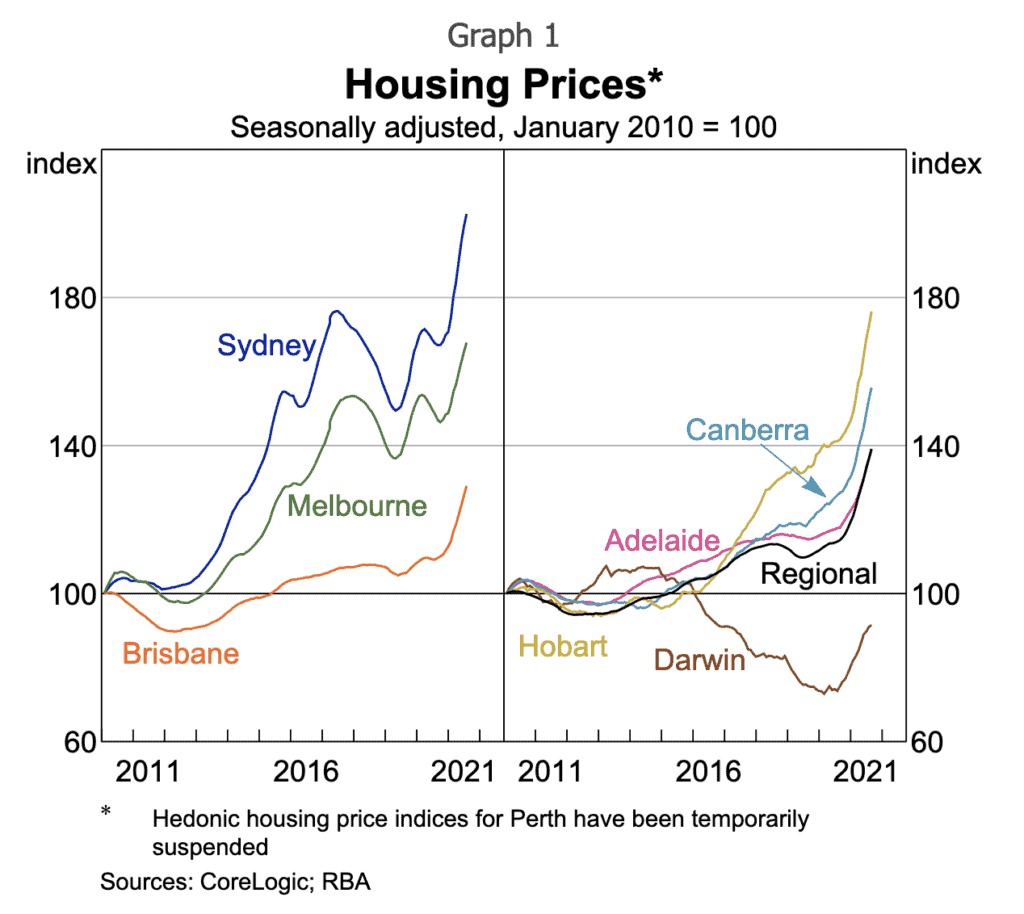
Secondly, you’ll notice in the chart below from CoreLogic that over the last decade capital city prices have generally grown faster than regional prices. Since the pandemic started in 2020 regional home price growth has outstripped capital city growth. Combined regional home value growth over the last 12 months is 23.1% versus 19.5% in capital cities.
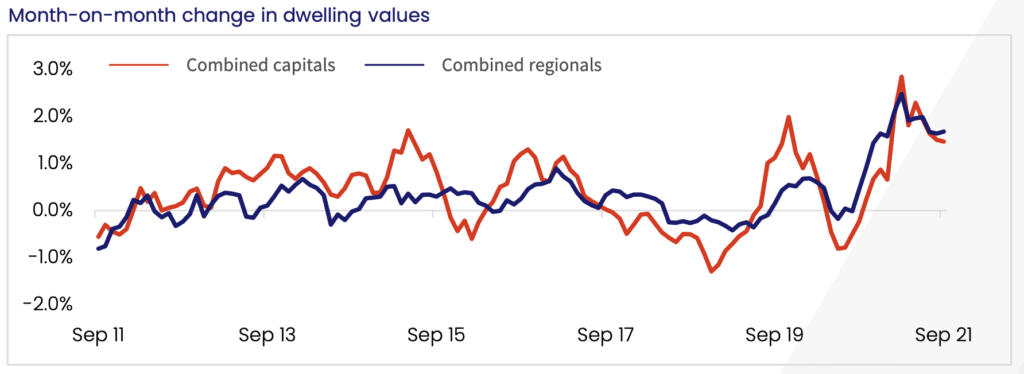
source: Corelogic
Watch this trend closely as it may impact future property price trends in capital cities as discussed in factor 2: Supply in our article on the 6 key factors that impact property prices.
4. Australian Population growth slows
Australia’s population growth slowed dramatically over the last 12 months.
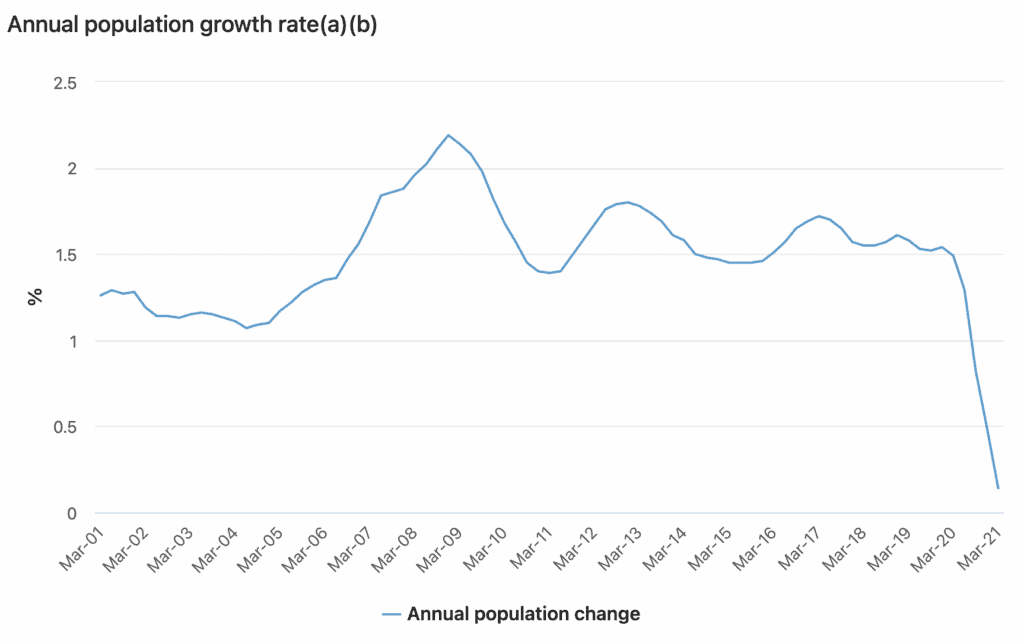
source: ABS Population Statistics
The key driver of this slow down was the drop in migration as a result of the pandemic.
source: ABS Population Statistics
We do expect population growth to return to normal once international borders open up.
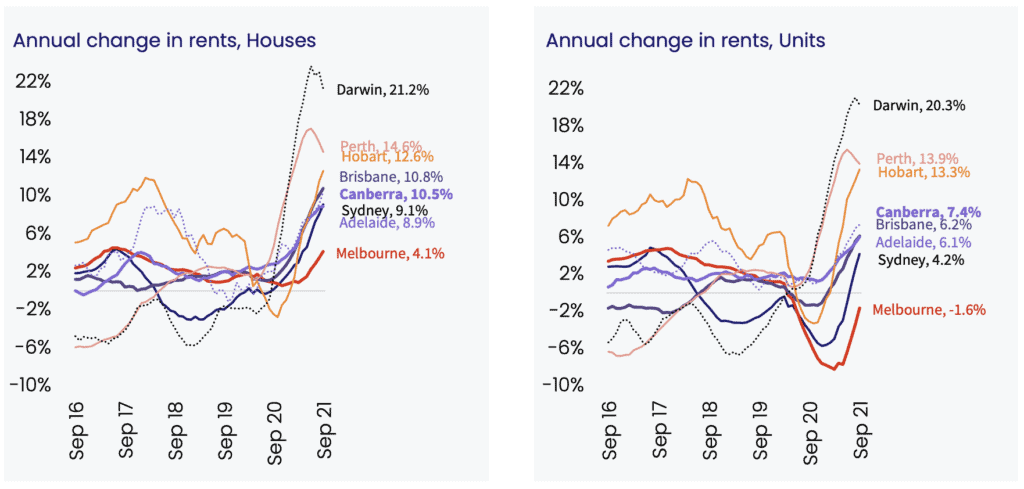
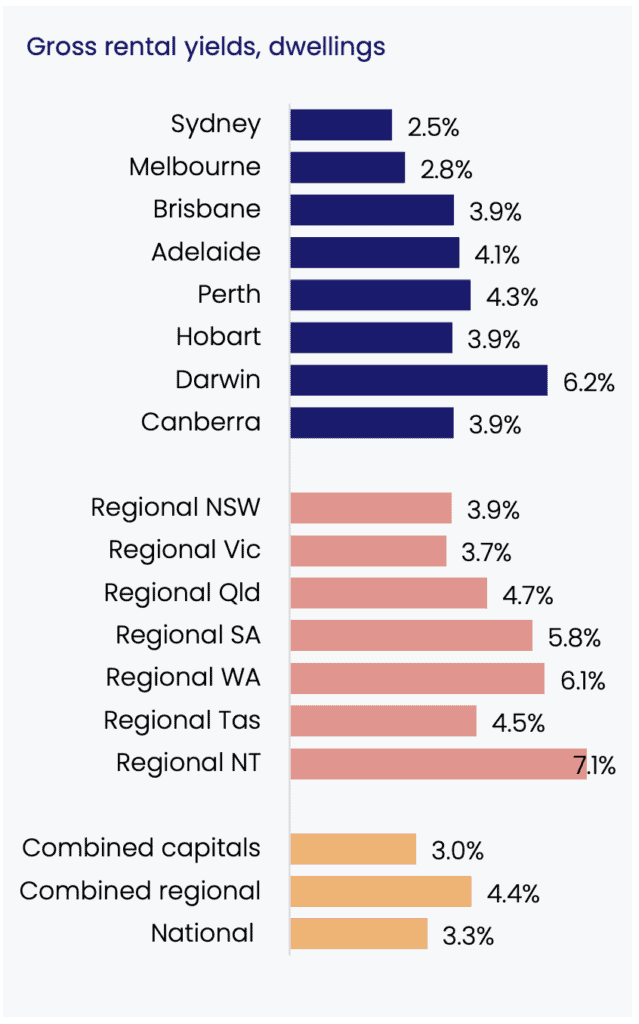
5. Rent yields declining as home prices rise.
Although Rents are rising…
source: Corelogic
Rental yields are declining as a result of home price growth outstripping rental growth. Gross rental yields fell to 3.0% in September.
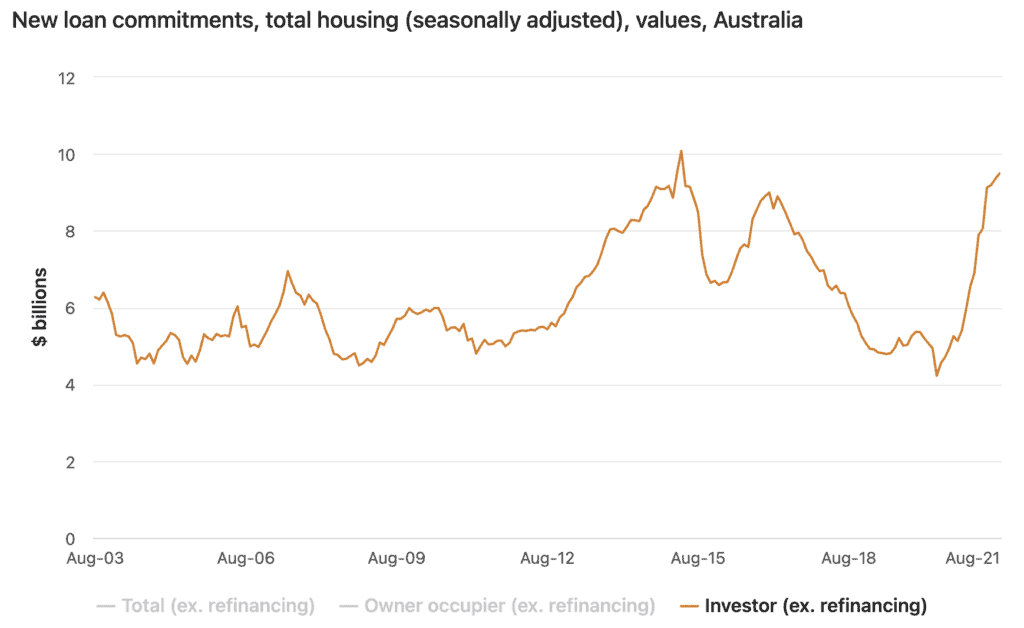
6. Property investment is growing
In August (according to the Australian bureau of statistics), property investment lending was the highest value since April 2015.
And there are 6 key things you need to know about the Australian property market.
Of course, if you need help to understand what your borrowing capacity is to support your next property investment give us a call or start the process to find your rate. We also have the following articles you may find helpful: